DividendOSReady to launchTrack, analyse, and plan
Track, analyse, and plan
income you can depend on.
A modern workspace for dividend investors. Understand risk, time your entries, and keep every ex-date, payout, and performance trend in one animated, lightweight view.
Automated dividend calendarResearch-grade dataSecure & private by designExportable reports

DividendOS signal
- Roll-up portfolio view with live highlights
- Dividend and earnings heatmap for fast scanning
- Insights you can act on without spreadsheets
12k+
Portfolios tracked
250k
Global tickers
4.5 hrs
Avg weekly time saved
5
Coverage regions
Built for serious dividend investors
Less busywork, more signal. Animated transitions, lightweight cards, and layouts that keep the next best action in view across desktop and mobile.
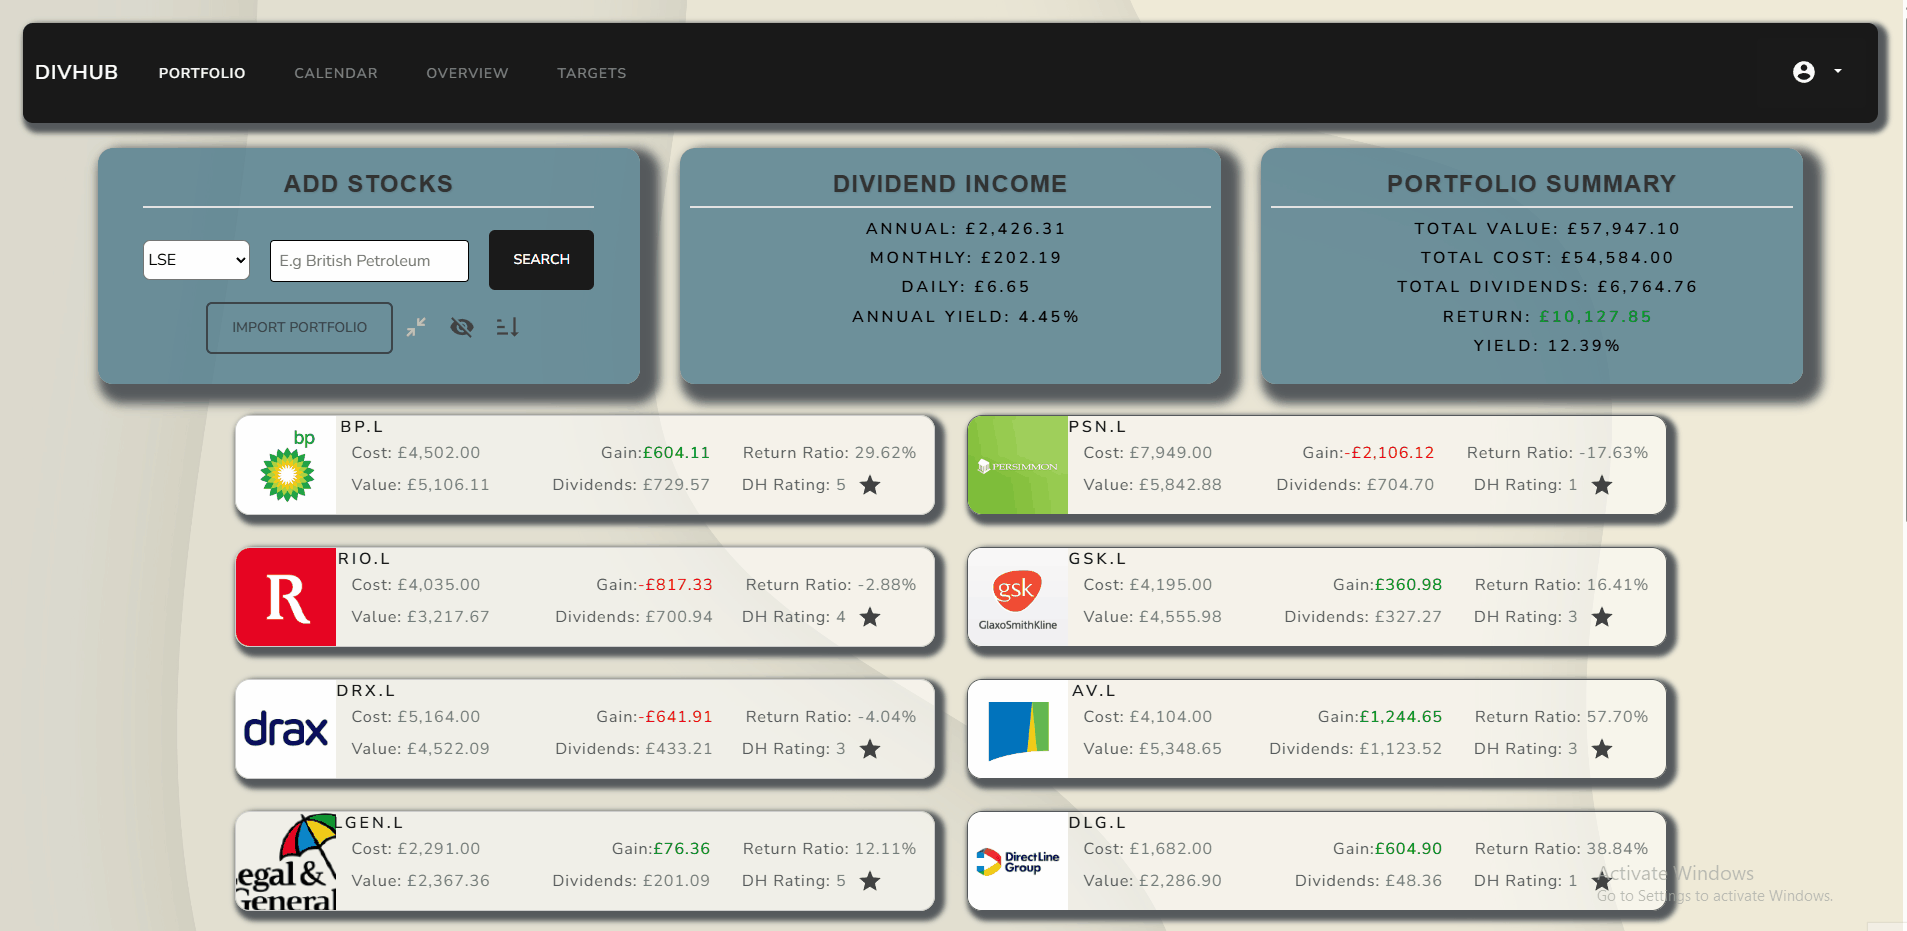
In-depth stock intelligence
Stay ahead with volatility, yields, risk ratings, and analyst-quality summaries for every holding.
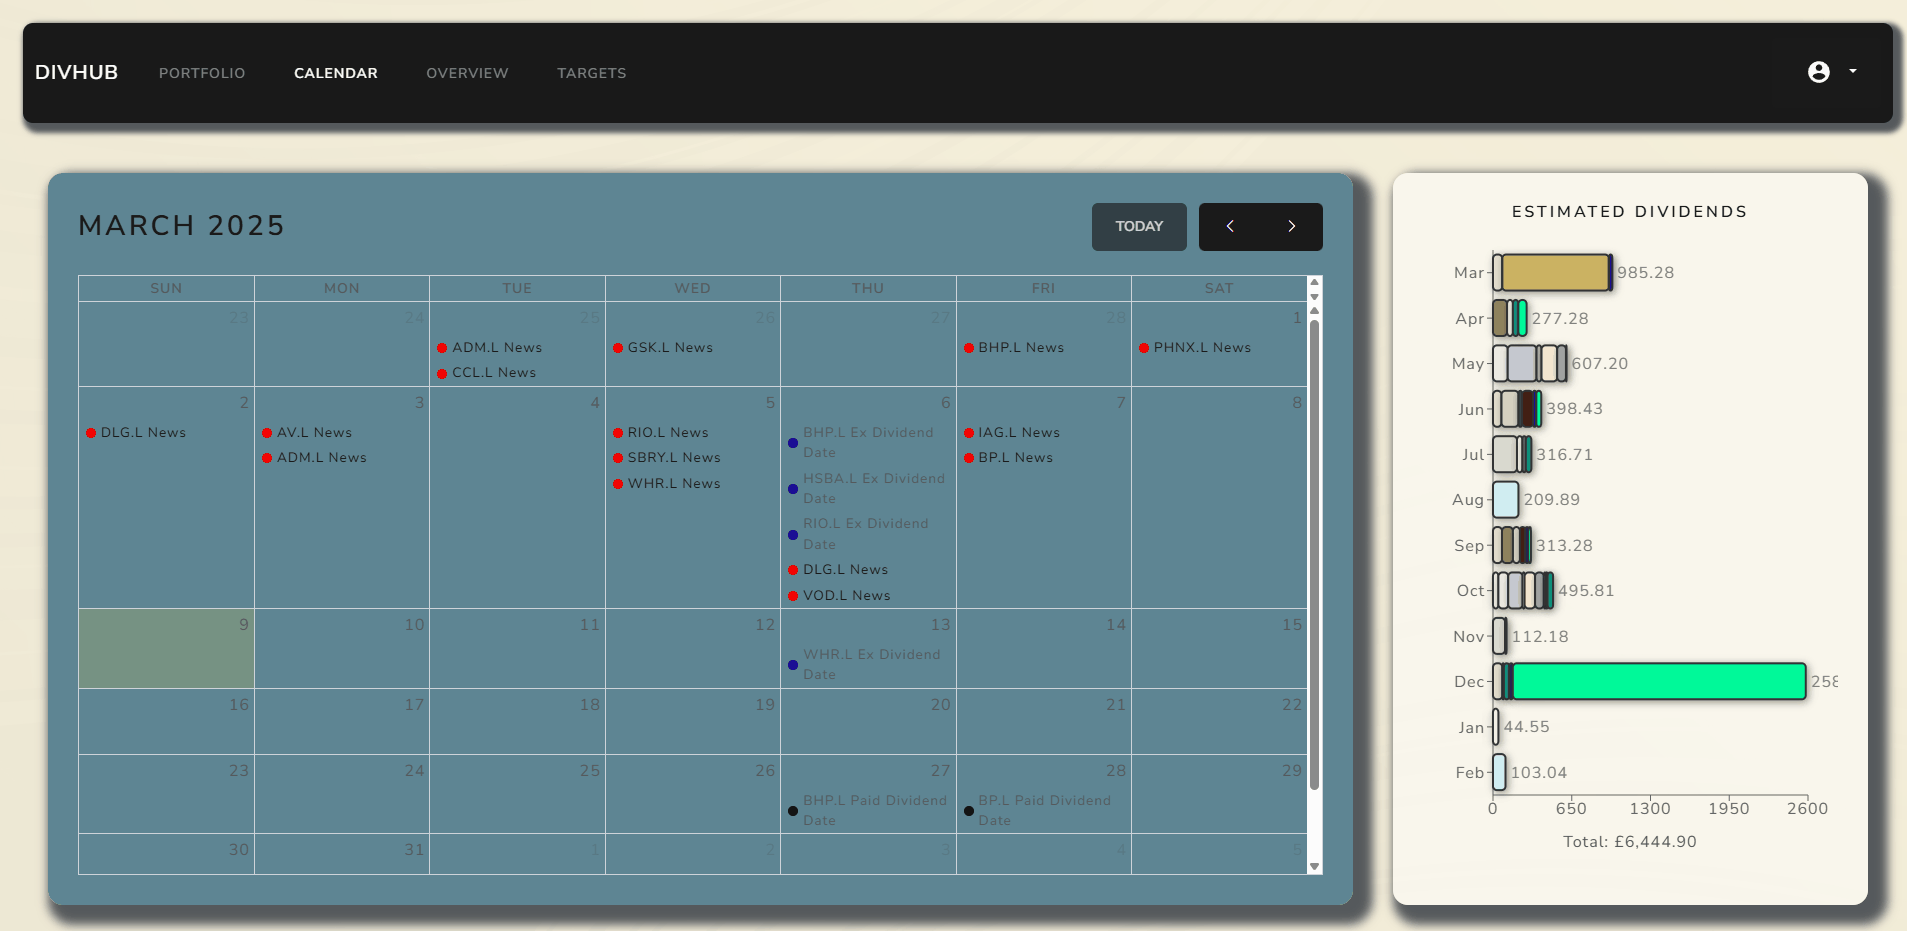
Interactive dividend calendar
Plan around ex-dates and earnings in seconds with a calendar tailored to your portfolio.
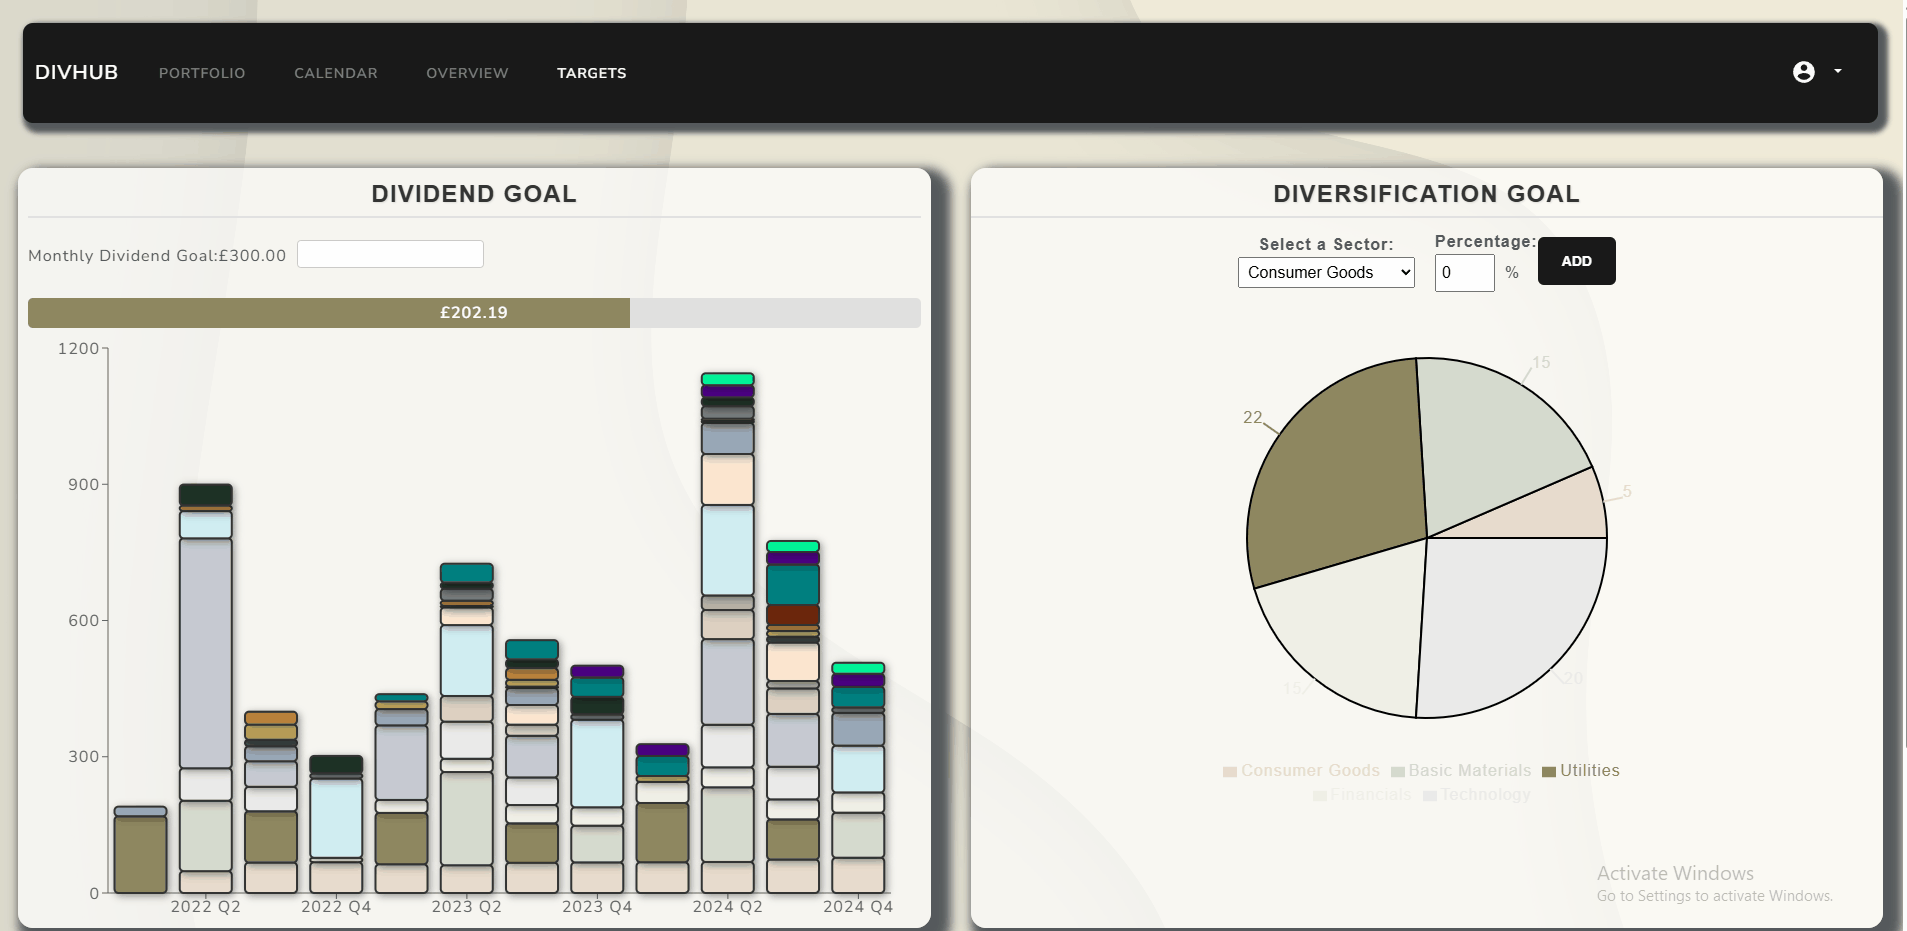
Target-driven planning
Model future income, test scenarios, and set cash targets that keep you on track.
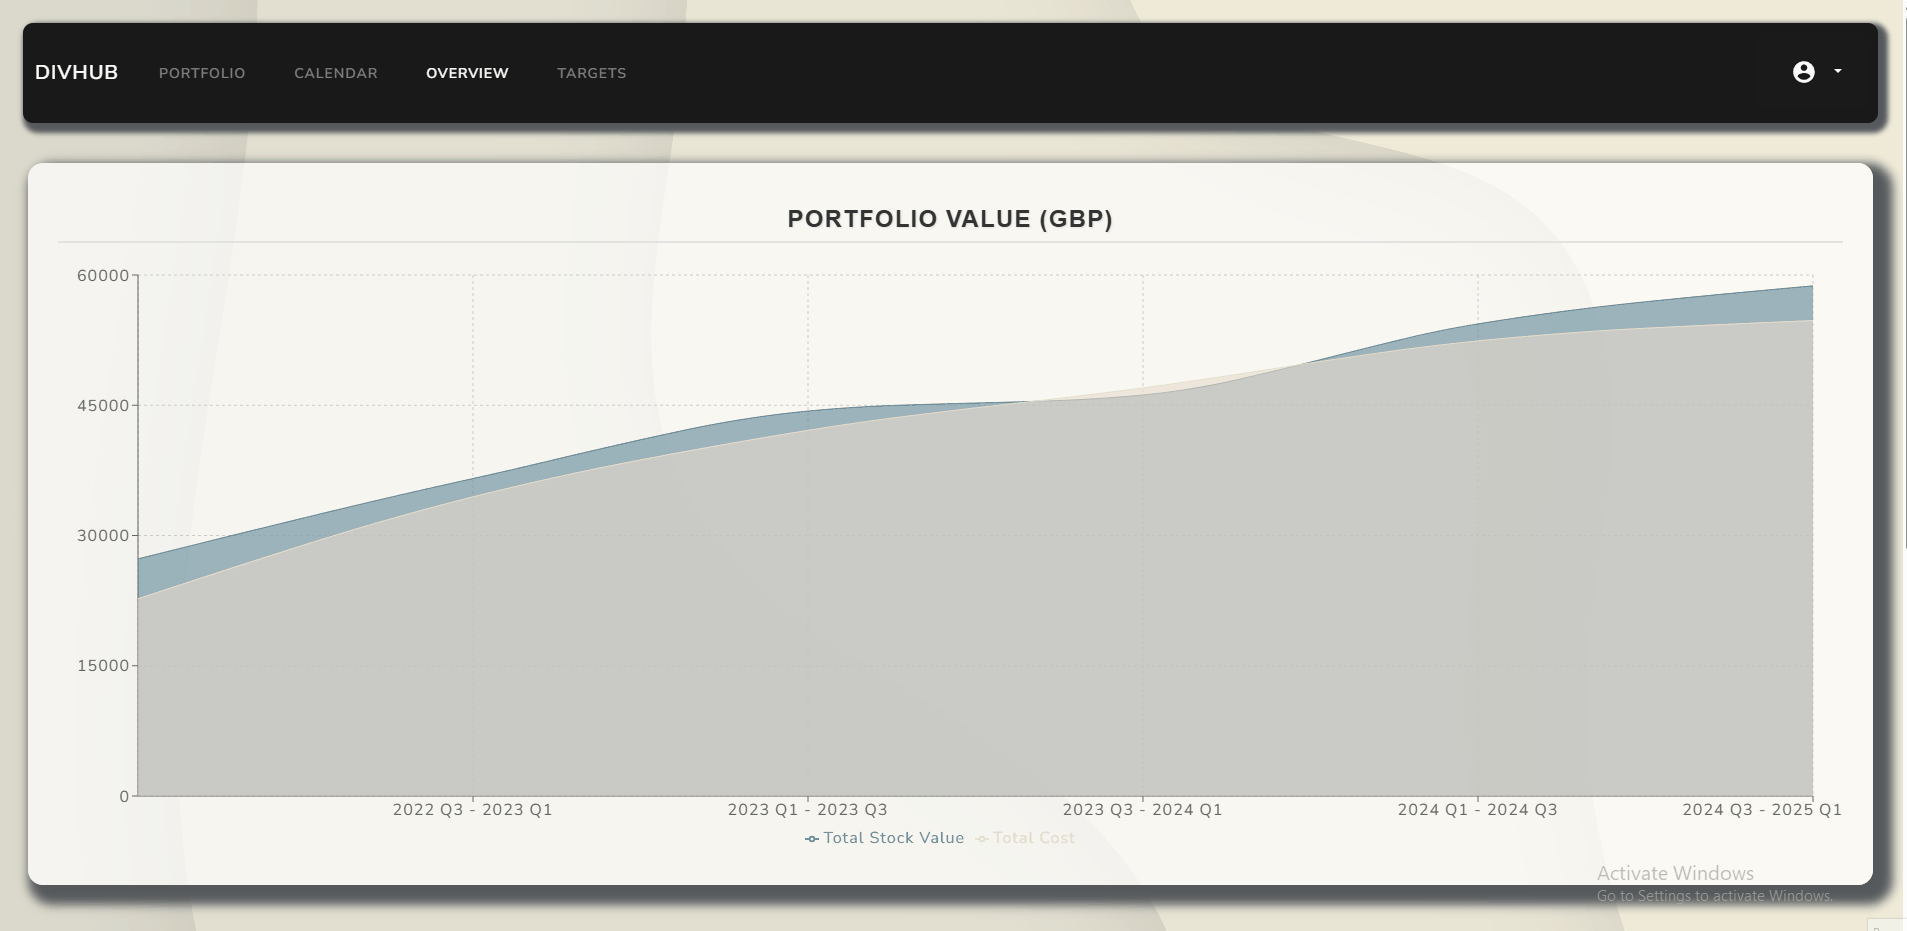
Portfolio at a glance
See allocations, yield mix, and diversification instantly with clean, explorable visuals.
Pricing
Ready to see your dividend plan come alive?
Launch your workspace, invite collaborators, and keep your next payout in sight.